Capital Structure Arbitrage – Making Sense of the Pieces
By Michael Khouw & Mark W. Guthner, CFA DASH FINANCIAL LLC


 Fund managers are in a never ending quest to determine value and compare it to price. If a portfolio manager perceives more value than price reflects, an opportunity to capture alpha is at hand. Capital structure arbitrageurs focus on individual issuers. They look for valuation differentials between a company’s debt and equity securities. To understand the relationship between these two financial liabilities, one needs to go beyond fundamental analysis and incorporate a third asset class…volatility.
Volatility and the price of Debt & Equity Securities
The value of a company’s assets are divided between its debt and equity securities. In the trivial case of a company with no net debt, the price of a company’s equity is equal to the value of its assets. Once debt is introduced into the capital structure, equity becomes a call option on company assets. The strike price of that call option is equal to the face value of the debt obligation. At the same time, the price behavior reflects that value of its assets less the value of the call option.
Debt + Equity = Assets
(Assets-Call) + Call = Assets
Examined in this way, volatility is a key ingredient into the value of both the debt and equity securities issued by a corporation. We know that the price of an option increases as the volatility increases. Therefore, this suggests the value of equity will increase if the volatility of returns on company assets increases, all other things held equal. It is important to recognize that a change in volatility does not change the value of the asset. As a result, the value of the debt must fall when volatility rises.
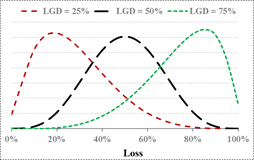 |  |
This make intuitive sense to the credit analyst. If the volatility of company assets rises or the company increases its debt load, the probability of default rises, which lowers the value of the company’s debt. If a company does default, lenders take over the company or the company’s assets are liquidated. In either case, debt has some recovery value, even in the worst of situations. Analysis of distressed securities focuses a great deal of energy on asset and debt valuation in a default scenario. In that process one estimates Loss Given Default (LGD), but the actual loss is uncertain. Historically, secured bank loans have a low LGD, unsecured bond issued into the capital markets have a higher loss rate, and subordinated loans tend to have a very high loss rate.
If a company is financed entirely with equity, we can say that asset value risk and equity value risk are one and the same. Once again, if we introduce some debt into the capital structure, and the proceeds of that debt financing is paid out to shareholders, some portion of that asset risk is transferred to bond holders. Said another way, some of the equity risk of the company has now shifted from shareholders to bond holders.
An investor who buys debt obligations, like a bank for example, will finance the purchase of that debt obligation with a combination of bank borrowing and bank capital. The amount of capital a bank holds against a loan is a function of equity risk. (Within this framework credit risk and equity risk are simply two sides of the same coin.) This is where risk translates and the interest rate change for a loan join hands. For a bank to make a loan that reflects the credit risk involved, it must earn its hurdle rate on the capital it uses to finance the loan. Below investment grade loans have a high degree of equity risk so the lender must finance that loan with a high level of equity. Just the opposite is true for investment grade loans.
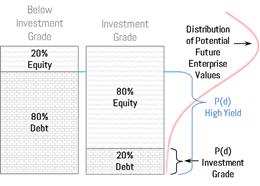
Since the face value of debt is contractually fixed, the price of equity is an assessment of the market’s view of a company’s asset value. On an enterprise value basis, a fall in the price of a company’s stock suggests the value of company assets has fallen causing the leverage ratio to rise. The above framework tells us that under such circumstances, market value of company debt should fall because the value of the company’s assets are more likely to fall below the face value of debt, resulting in a default. With this construct, we now have a direct link between the value of equity and the value credit risky debt. Recall that volatility does not drive the price of company assets, but it does have an impact on how value is shared between debt and equity. In the final analysis, the value of equity and volatility of assets are critical factors in the determination of credit risky debt.
Example: JCPenny 5.75% Coupon Bond Due 2/18/2018 (as of 4/23/2014)
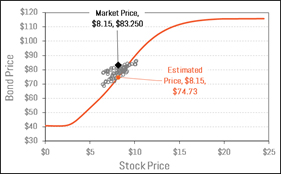 | 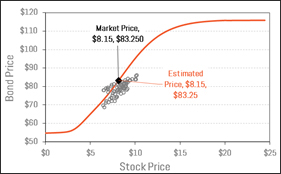 |
| With the above construct in hand, we take a moment to apply this framework to the debt of JCPenny & Company. We have chosen to examine the 5.75% coupon bonds due 2/18/2018. The chart to the left shows us the expected relationship between this debt obligation and the company’s equity, assuming an LGD of 49.1% which is the historical average for unsecured debt issued by a retailer. The grey dots are historical data points representing the closing price of the stock and bond going back to 9/27/2013, which is just after the company’s last equity fund raise. Notice that the market price of the company’s debt is trading 8.52 points higher than the model price. This tells us something quite valuable. The market is assuming a LGD which is 11.0% smaller than the historical average. This differential makes sense as the company has a fair amount of cash on its books and having suffered serious losses over the past few years, the company has some tax loss carry forwards, which are intangible assets that have economic value. By incorporating the market implied LGD we see the model aligns with the prices witnessed in the market place. | |
Creating Synthetic Credit Risky Debt
Derivatives contracts are used to both hedge and to replicate certain risks. We can do the same with credit risk. Most notably, most sophisticated fund managers employ Credit Default Swaps (CDS) to replicate the performance of credit risky debt or to hedge existing positions. To trade CDS, one needs to have ISDA agreements set up with counterparties. There are asset managers that do not want or cannot get ISDA agreements for a number of reasons. Those who cannot transact CDS contracts find there are alternatives available by combining securities in the cash and listed derivatives markets. In the following example, we show how one might combine US Treasury Bonds, company issued stock and listed options to mirror the performance of the company’s debt obligations. This is achievable because of the following relationships.
Debt = Asset – Call, or Debt = Cash + Put
We cannot buy company assets or options on those assets. But we can use the company’s equity and options on that equity as a proxy. In so doing we know that debt is equal to equity less a call. We indicated above that lenders expect some level of recovery in a default scenario. This recovery acts as a floor to the value of credit risky debt and can be characterized as a put option. As a result, we can replicate the performance of credit risky debt by purchasing equity, selling a call and buying a put.
Synthetic Credit = Equity – Call + Put
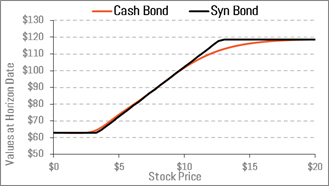
By applying this principal, we can replicate the JCPenny bond synthetically. The particulars of the solution are presented in the table below. In this example, we employ options that expire in one year. If we look at the chart below we see the payoff pattern of the synthetic option position. Notice that the payoff pattern of the synthetic bond is nearly the same as the cash bond.
 | 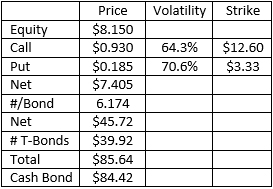 |
Given current market prices, the synthetic bond costs $1.22 (85.64-84.42) more than the cash bond making the cash bond a better deal if one believes the market implied LGD is correct. Recall the market assumes an LGD 11% higher than the historical norm. If one wanted to capture this $2.05 premium, one could buy the cash bond and sell the synthetic.
With breakeven analysis, there is more information to be gleaned. To close the $1.22 gap the price of JCP stock would have to fall by about $0.33. Alternatively, the volatility surface would have to rise by 9.4%.
At the end of the day it is important to remember that debt and equity are claims on the same asset. Asset volatility is a commonality across those claims as well. Anchored by a common asset, debt and equity issued by the same firm must behave in a predictable lockstep manner. When the price of debt, equity or volatility step out of line, an opportunity is created for those with the flexibility to invest across a company’s capital structure.
The beauty of using derivatives instruments to create synthetic securities is flexibility. Options traders will recognize the solution presented above is long equity and short a risk reversal. We see from the chart above that the payoff pattern of this structure looks like a falling over “S.” One should be aware that this same shape produced by a long call-spread or a short put-spread plus a position in treasury bonds.
Flexibility does not end there. One can customize the payoff pattern of the synthetic bond. Assume for a moment a fund manager does not believe the company will fully recover over the one year investment horizon. To improve yield, one might sell a call with a marginally lower strike price. If one is confident that JCPenny will survive, they might buy a lower strike put. Both of these alternatives will increase the yield on the synthetic security. In the final analysis, derivatives and synthetic securities help professional investors value securities and customize return profiles in a way that cannot be achieved with vanilla debt and equity obligations.
Disclaimer: DASH does not guarantee that the foregoing material is accurate or complete and accepts no liability for any losses arising from the use of this information. This information is not a complete summary or statement of all available data necessary for making an investment decision and does not constitute a recommendation. The information contained in this report does not purport to be a complete description of the securities, markets or developments referred to in this material. Past performance may not be indicative of future results.


